What Is Technical Analysis?
While fundamental analysis tells you what to buy and identifies quality and fair value of securities, technical analysis helps to determine when to buy and identifies sentiment and timing. Technical chart analysis studies historical market data, mainly price and volume to forecast the future price movement based on historical trends and market psychology that can repeat itself. Major techniques include identifying chart patterns such as head and shoulders, triangles, and using technical indicators such as moving averages, MACD and RSI to find entry and exit points.
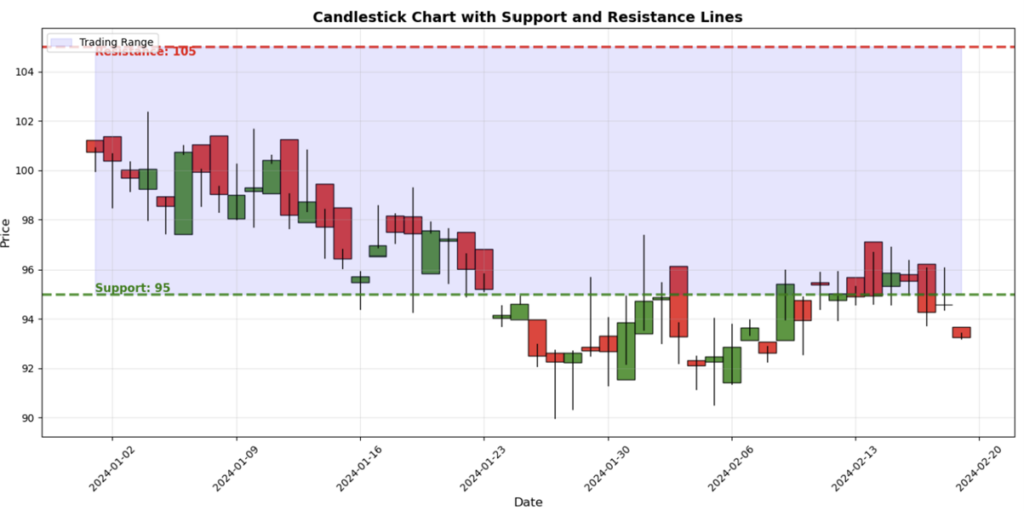
Support and Resistance
Support indicates the level where a price tends to stop falling, acting as a floor and resistance is the level where a price stop rising, acting as a ceiling.
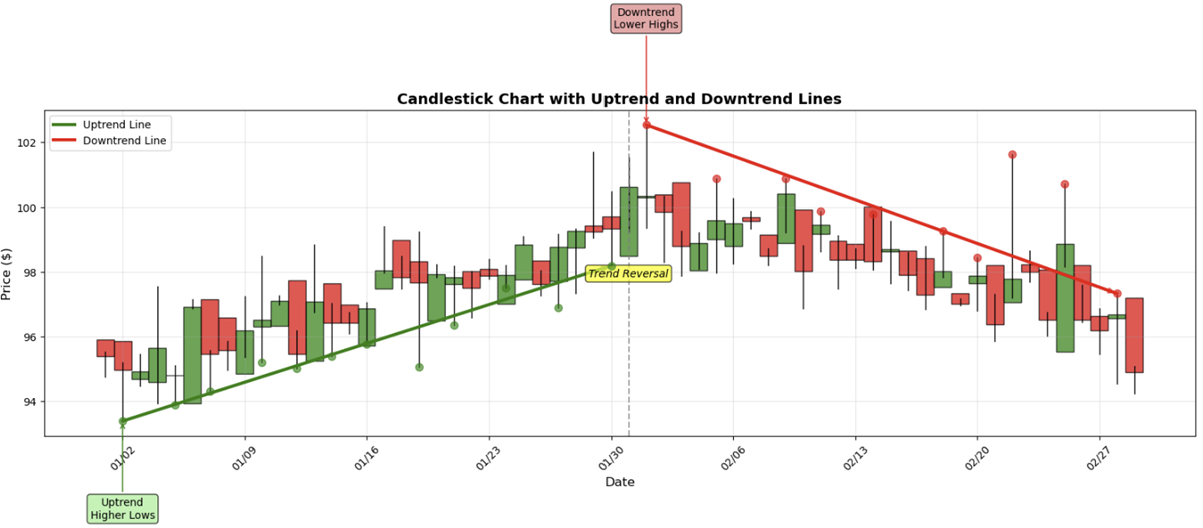
Trends
Trend identifies directions whether it’s uptrend, downtrend or sideways using trendlines connecting at least two peaks or troughs. You can use technical indicators to identify trends.
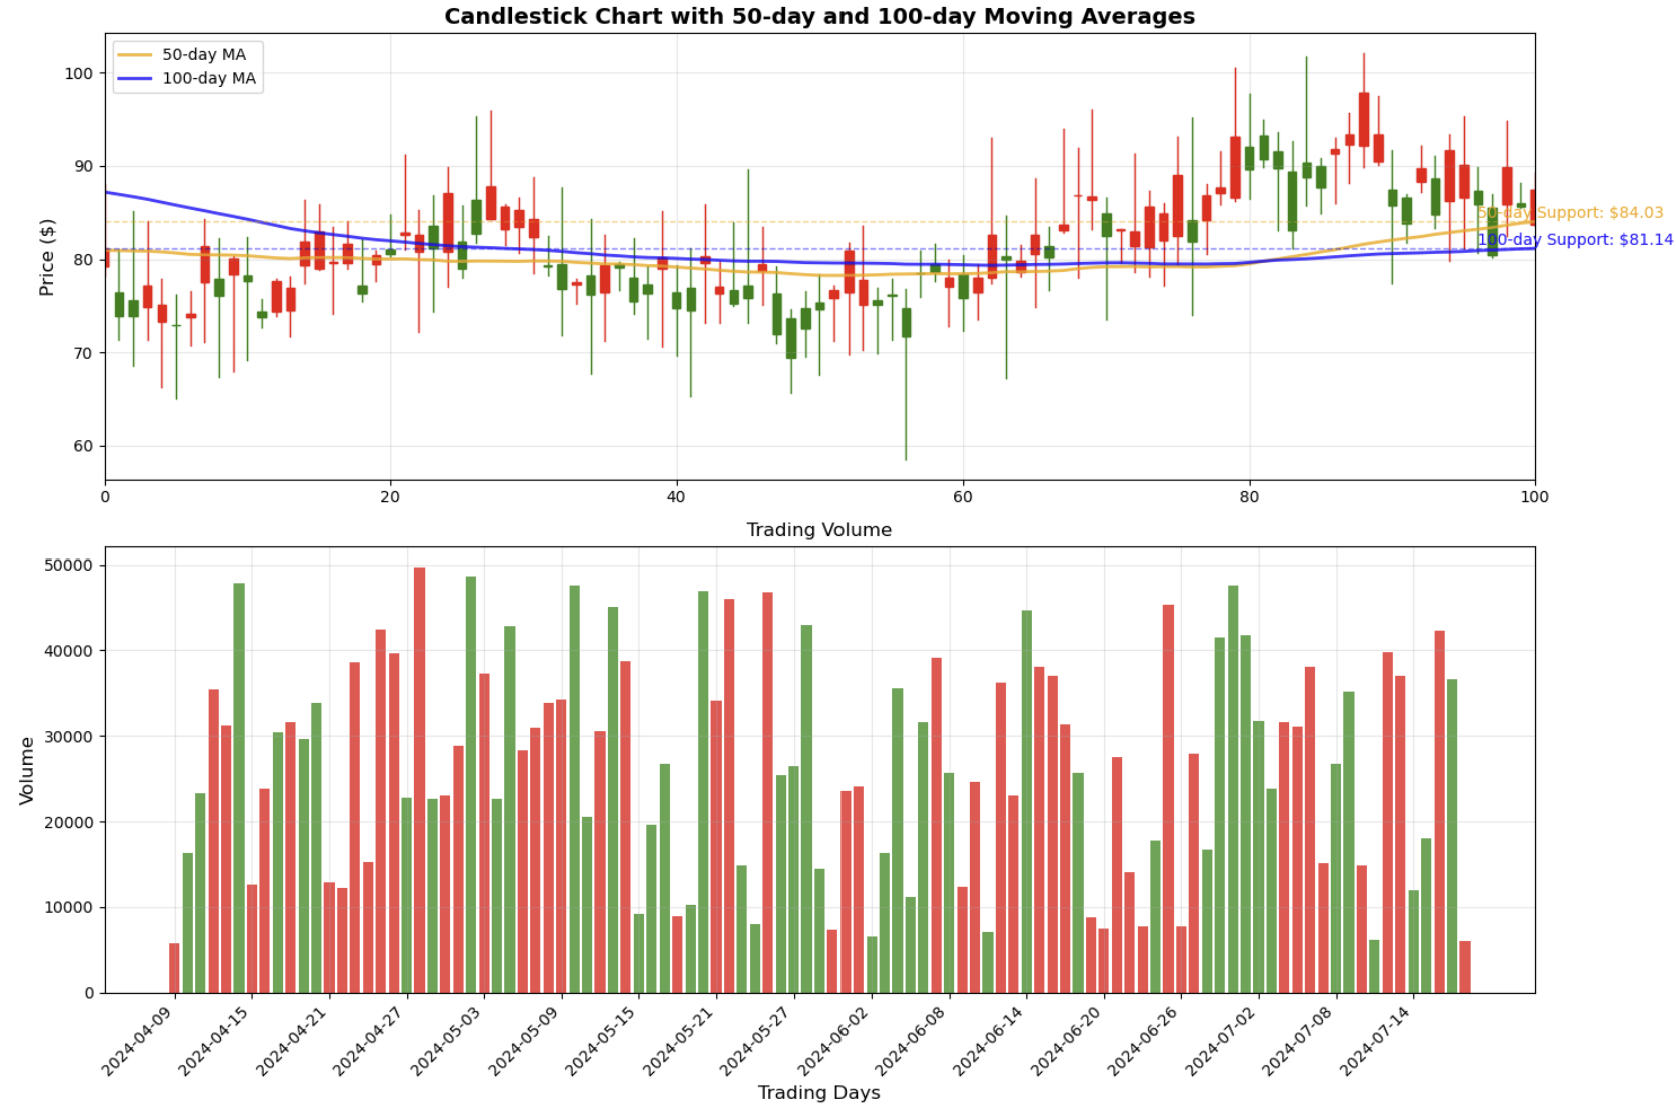
Moving Averages (MA)
Moving averages track the price of assets over a set number of periods, smoothing out short-term fluctuations in prices to identify a trend. It helps to identify price trends and potential reversals by averaging past data points over a specific period of time. MAs calculate the average of a dataset over rolling intervals. As new data points are added, older ones drop off, creating a moving effect.
Simple moving average (SMA) provides equal weights to all data point and used for long-term trend analysis such as 50-day, 200-day simple moving averages, which smooths out daily price fluctuations. Exponential moving average (EMA) gives more weight on recent data for short-term trading signals.
For example, support above 50-day and 100-day moving averages can mean a bullish signal.
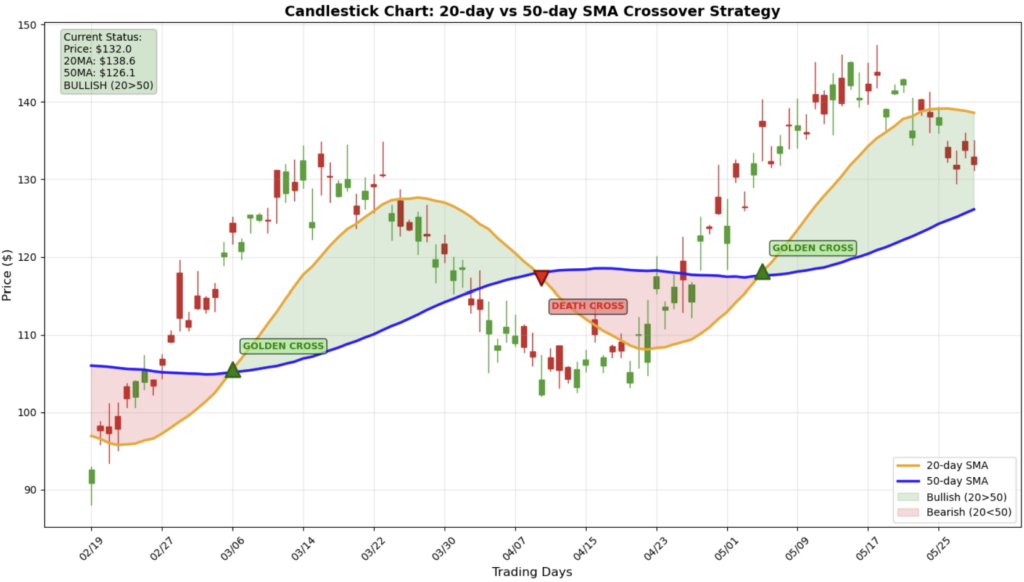
A 50-day vs 20-day simple moving average crossover
is one of the most widely used technical signals in equity and forex trading. 50-day
SMA is more sensitive to recent price changes, while 200-day SMA reflects a
broad view of market direction. When the 50-day moving average crosses above
the 200-day, called a “Golden Cross”, it signals momentum turning bullish. Conversely,
when 50-day SMA falls below 200-day SMA, called “Death Cross”, it signals momentum
turning bearish. These crossovers suggest potential long-term trend shifts, but
they are lagging indicators as they react to past data and cannot predict
sudden market shocks. In addition, crossovers can mislead investors when markets
are too volatile. Smart investors should wait for retracements to support or
resistance levels before entering positions rather than buying or selling immediately
at the crossovers.
Moving average is a useful trend analysis
tool, but it needs to be combined with other indicators such as MACD, RSI or fundamental
analysis to avoid relying on lagging signals.
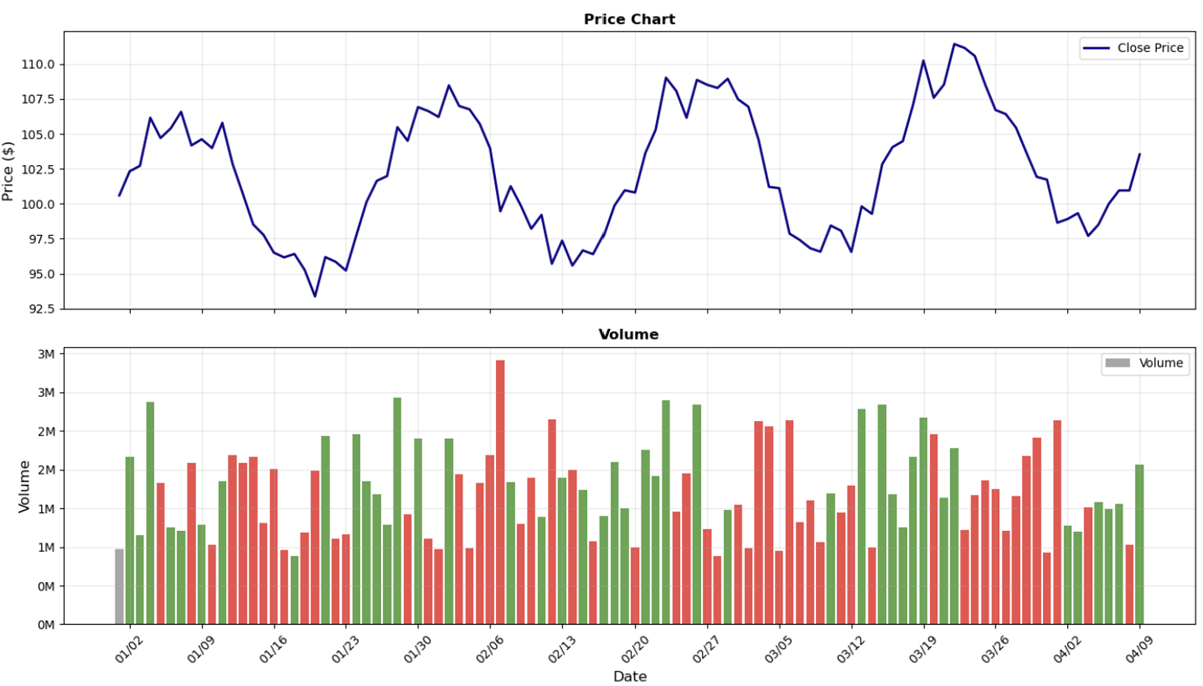
Volume
It measures the strength of a price movement with high volume confirming that trends exist.
Oscillators (RSI, MACD)
Oscillators measure momentum and it helps to identify overbought or oversold conditions.
MACD (Moving Average Convergence Divergence)
It is a trend-following momentum indicator that performs best when a market is trending. It can be less reliable in a ranging or sideways markets. It shows the relationship between 2 moving averages of a security’s price and measures the momentum behind the price move. It is calculated by subtracting the 26-period exponential moving average (EMA) from the 12-period EMA (12-period EMA – 26-period EMA). Representing the convergence and divergence of the two trend-following moving averages, when the MACD line is above zero, it means the 12-EMA is above 26-EMA, signalling bullish momentum. Conversely, when it is below zero, it indicates bearish momentum. The signal line is 9-period EMA, the MACD line itself. It acts as a trigger line for buy and sell signals.
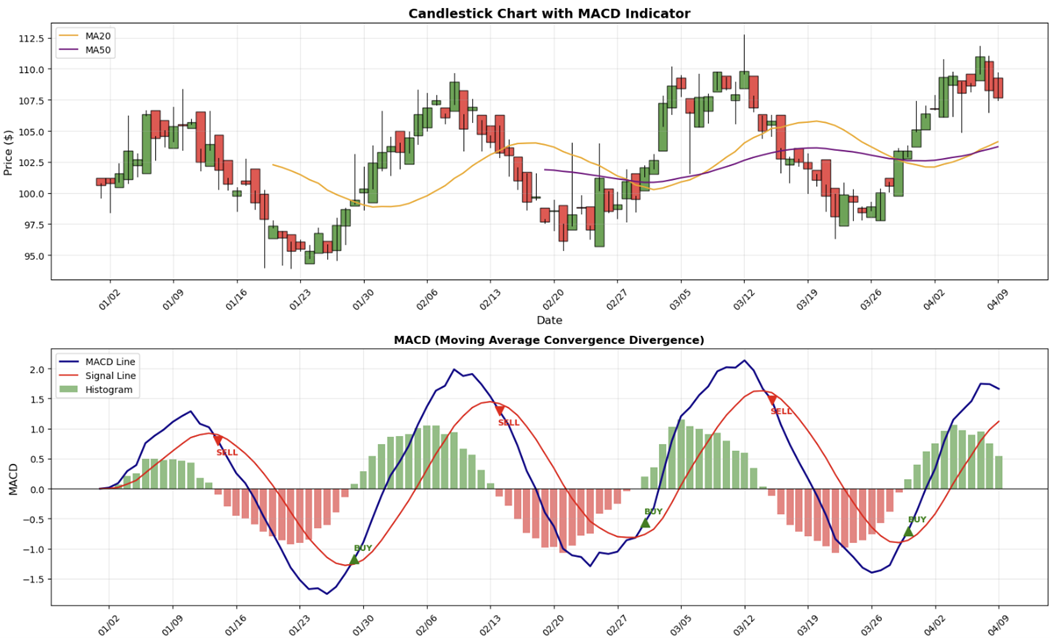
The Crossover Strategy (Momentum shifts): Bullish signal occurs when the MACD line crosses above the signal line. This will be a buy signal showing momentum is shifting to the upside. Bearish signal occurs within the MACD line crosses below the signal line. This is a sell signal suggesting momentum is shifting to the downside.
The Divergence Strategy (Trend Reversals): Divergence warns that the current trend is losing strength and about to reverse. It occurs when the price action and the MACD indicator move in opposite directions. Bearish divergence occurs when the price still makes higher high, but the MACD makes a lower high. This shows that the price is still going up, but the momentum behind the move is slowing down. This can be a sell signal. Conversely, bullish divergence happens when the price makes a lower low, but the MACD makes a higher low. This shows that the selling pressure is slowing down and bullish momentum is building up, signalling a buy.
RSI (Relative Strength Index)
RSI is a momentum oscillator that measures the speed and change of price movements. This indicator identifies overbought and oversold conditions. It oscillates between 0 and 100. When RSI rises above 70, it indicates the asset has been overbought and the price has moved up too fast and it is due for a pullback or a consolidation. However, in a strong uptrend scenario, the RSI can stay above 70 for a long time. When the RSI line drops below 30, it suggests the asset has been oversold. The selling pressure has been exhausted and the price can be due for a reversal to the upside. It is a warning signal for shorts, not an automatic buy signal.
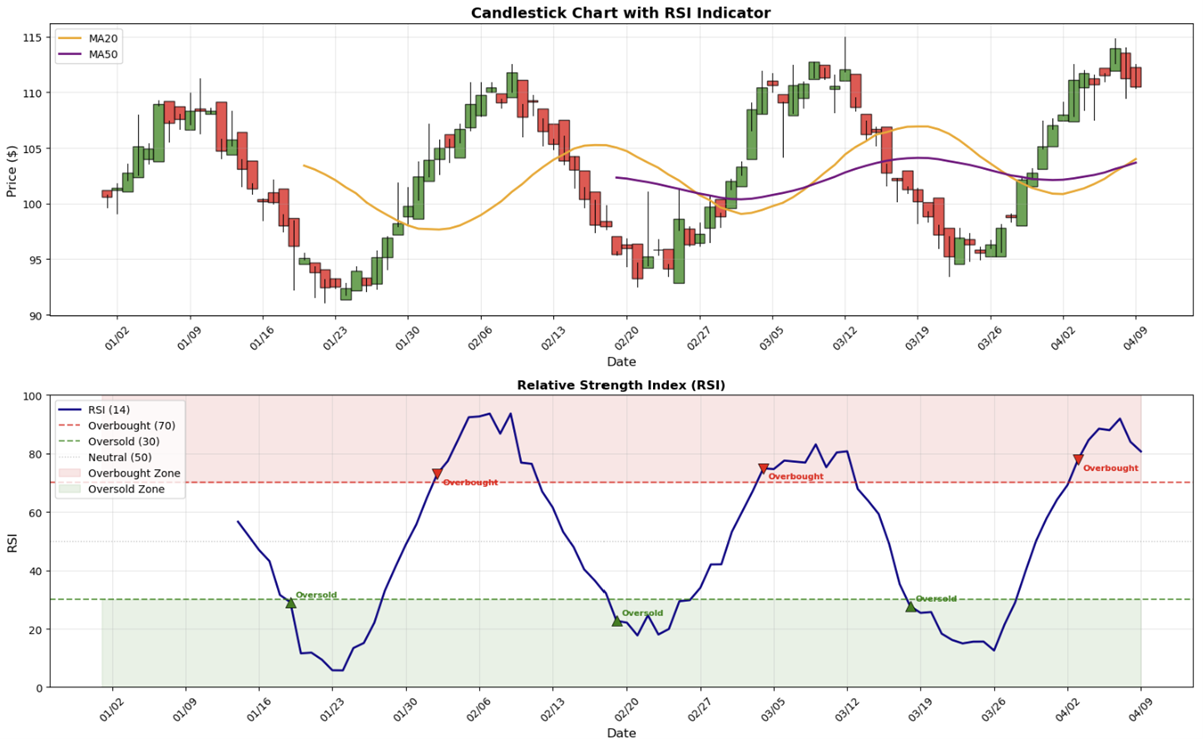
Bullish Divergence: When the price makes a lower low while RSI makes a higher low, it shows the momentum of selling is decreasing although the price hits a new low. The bears are losing their grips and a reversal to the upside can be likely.
Bearish Divergence: When the price makes a higher high while RSI makes a lower high, the momentum of buying is decreasing, although the price hit a new high. The bulls are running out of steam and reversal to the downside is likely.
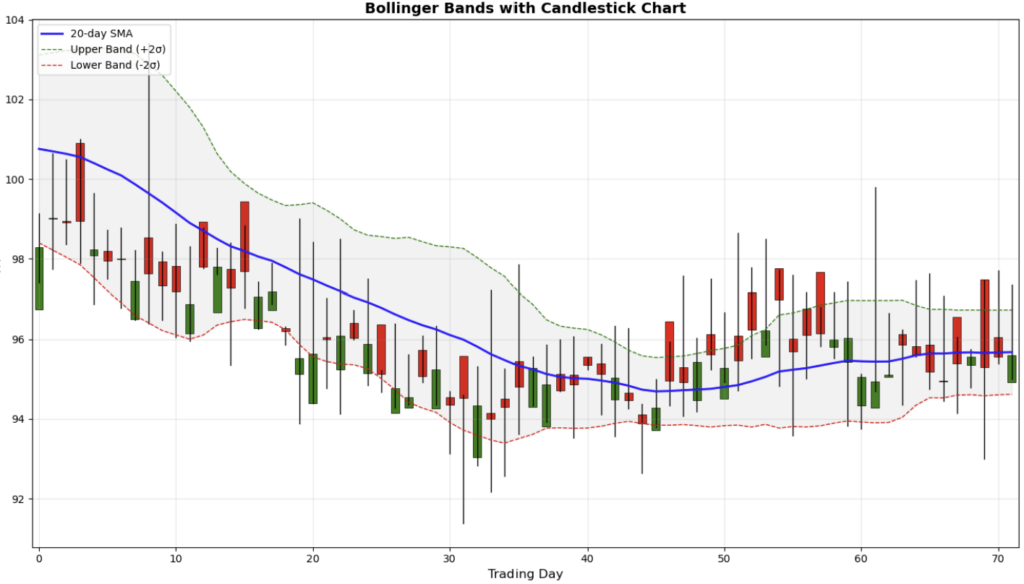
Bollinger Bands
Bollinger Bands are another popular technical analysis tool consisting
of three lines plotted on a price chart to measure market volatility and
identify potential overbought or oversold conditions. Three components include
middle band (20-day simple moving average, SMA), which serves as the baseline
for the upper and lower bands, upper band (middle band, 20-day SMA of the
closing price + 2 * standard deviations) and lower band (middle band – 2 *
standard deviations). It measures market volatility with the band widening when
the volatility increases and contracting when the volatility is low (“Bollinger
Squeeze”). Investors can adjust the period (e.g., 10-day for short-term, 50-day
for long-term) and type of average (e.g., Exponential Moving Average) depending
on the strategies. When the price moves outside the upper band it suggests the
asset is overbought. But it may not be a sell signal in a strong uptrend. Price
touching the lower band suggests the opposite.
There are several primary equity strategies using Bollinger Bands:
Mean Reversion Strategy (in a range-bound market): This strategy assumes that the stock price will eventually revert back to the middle band (20-day SMA). Price touching or closing below the lower band can be a long entry signal, while price touching or closing above the upper band can be a sell entry signal. This strategy works better for large-caps, non-trending stocks such as utilities and consumer staples that trade in sideways. However, during earnings season, a surprise can cause the price to ride on the band rather than revert back.
Volatility Breakout strategy (Bollinger Squeeze): This is a momentum strategy to catch the start of a major equity
movement. When the band narrows (the “squeeze” happens), it indicates historically low volatility. There could be price closing outside the squeezed band (above the upper band or below the lower band) accompanied by an increase in volume. Those points can be entry signals. This strategy utilizes the fact that periods of low volatility are often followed by periods of high volatility. In equity market, this often happens before a major product launch, FDA approval, or earnings surprise.
Bollinger Band “W” Bottoms: This is a pattern recognition strategy for identifying a reversal from a downturn or a transition to an uptrend. When the price makes a low below the lower band, it is the first bottom. Price later bounces toward the middle band and then price falls again, but this time around, it makes a higher low, inside the band suggesting the selling pressure is dissipating. Buy entry signal is when the price breaks above the middle band with increasing volume.