What Are the Technical Indicators for Forex Trading?
Trend-following indicators
They help to identify the direction and strength of a trend.
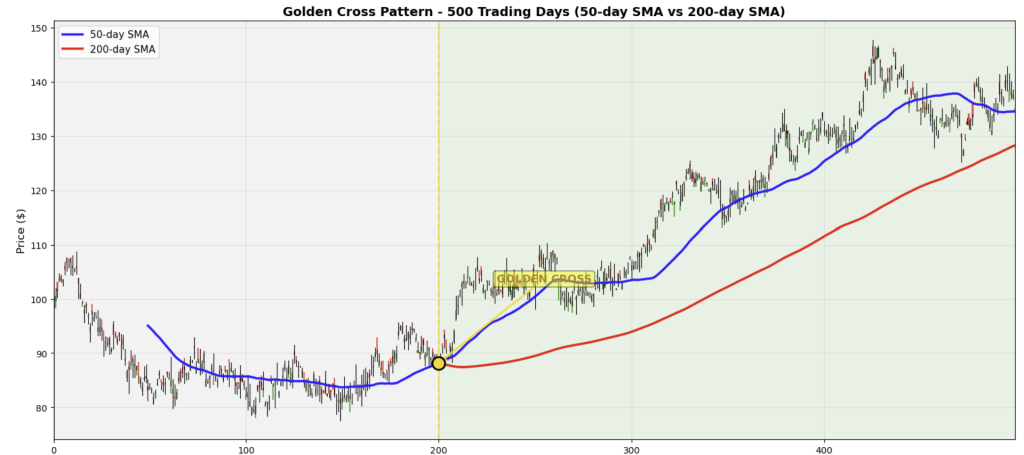
Moving Averages (MA): The Simple Moving Average (SMA) smooths out price data, while the Exponential Moving Average (EMA) places greater emphasis on recent data, making it more sensitive to market shifts. A widely used approach is to track moving average crossovers, such as the “golden cross”.
Golden cross: A golden cross is a widely recognized technical chart pattern that indicates the potential onset of a strong bullish trend. It occurs when a short-term moving average rises above a long-term moving average, often interpreted by investors as a buy signal. The most common version involves the 50-day simple moving average crossing above the 200-day simple moving average. Because it is based on past price data, the golden cross is considered a lagging indicator — by the time the crossover appears, a significant portion of the upward move may
already have occurred. Moreover, in volatile or sideways markets, it can occasionally generate misleading signals.
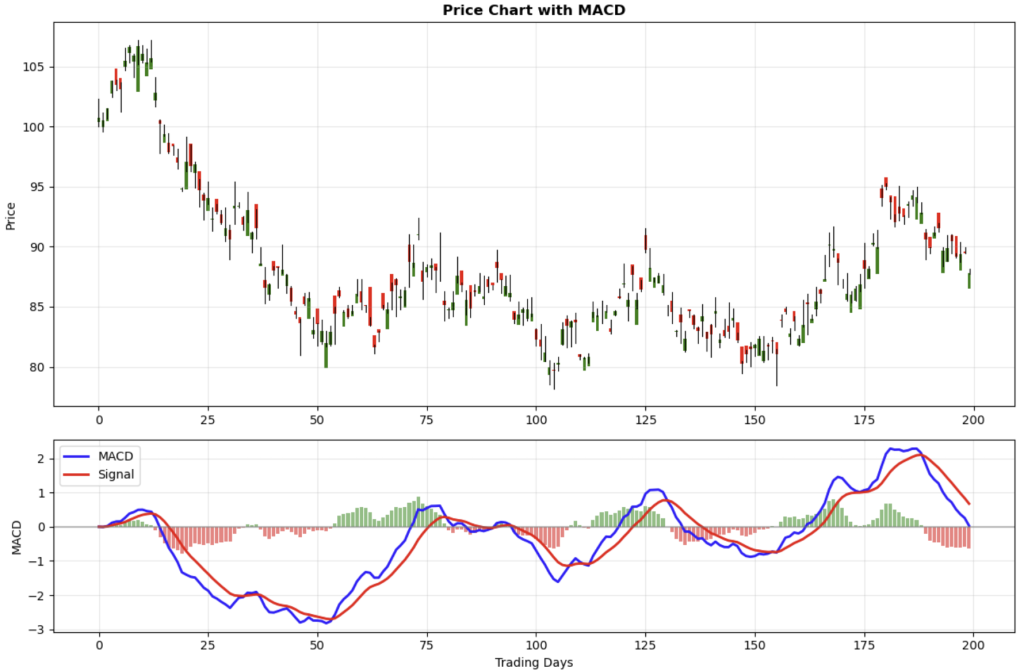
Moving Average Convergence Divergence (MACD): It
shows the relationship between two EMAs. Investors watch for crossovers of the
MACD line and signal line as well as divergences with price action.
The MACD line (the fast line) is derived by subtracting the
longer-term Exponential Moving Average (EMA) from the shorter-term EMA —
commonly the 12-period EMA minus 26-period EMA. Because it uses shorter-time
frames, it responds quickly to recent price movements. The signal line,
(the slow line) is the 9-period EMA of that MACD line. By averaging the MACD
line itself, it moves more gradually and serves as a smoother trigger for
potential buy or sell decisions. The histogram illustrates the gap
between the MACD line and the signal line: it is positive (above zero) when the
MACD line is above the signal line, and
negative when it falls below.
Momentum & Oscillators
This measures the speed of price changes,
helping to spot overbought or oversold conditions and potential reversals. These indicators help to time an entry during a
pullback within the trend.
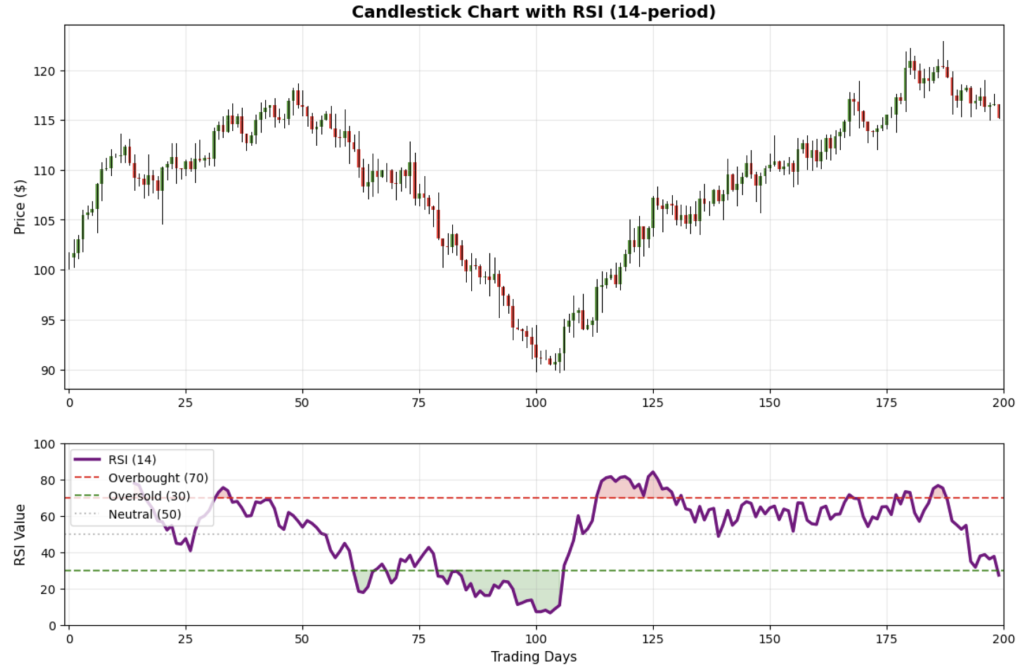
Relative Strength Index (RSI): It measures the magnitude of recent price movements.
Readings above 70 generally indicate overbought conditions, while values below
30 suggest oversold conditions. A Divergence between RSI and price action often
signals a potential trend reversal.
Volatility Indicators
These indicators capture the volatility of a
currency pair, making them essential for setting stop-loss levels and
evaluating the strength of potential breakouts.
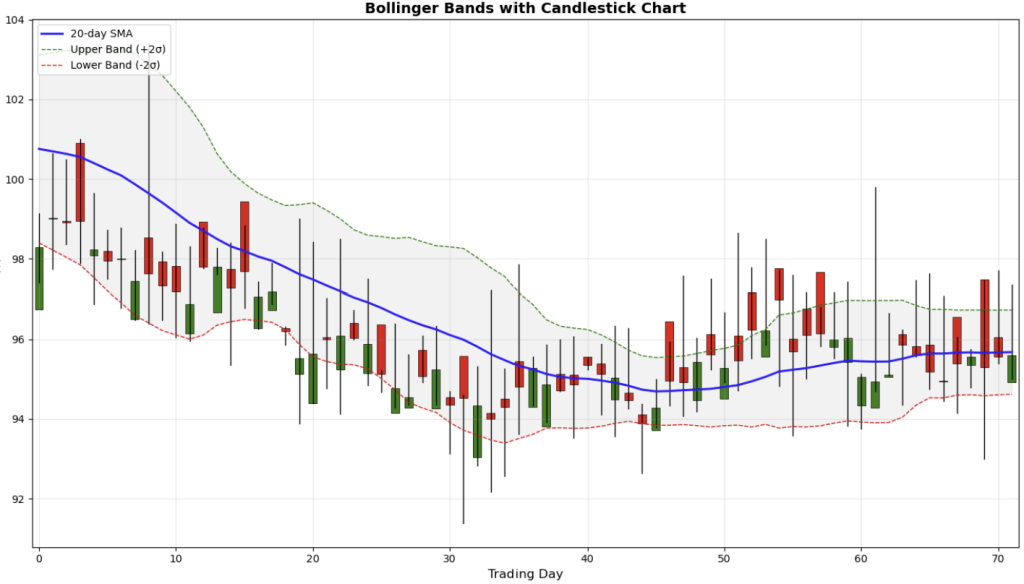
Bollinger Bands: Bollinger Bands are composed of a simple
moving average (the middle band) and two standard deviation lines above and
below it. The bands widen during periods of high volatility and narrow when
markets are calm. A “Squeeze” often indicates that a breakout may be imminent.
Average True Range (ATR): It measures market volatility without indicating price direction. A high ATR value means wide trading ranges, and this indicator is widely used to set stop-loss distances that adapt to prevailing market conditions.
Combining the indicators into a strategy
Define the Trend: Add a 200-period exponential moving average (EMA) to the chart. If price is above the 200 EMA, look for long (buy) trades. If price is below the 200 EMA, look for short (sell) trades. This will keep you from trying to pick tops and bottoms against the dominant flows.
Find the entry: Add the RSI set to a 14-period with levels at 30 and 70.
Long Trade (price above 200 EMA): Wait for the price to pull back towards 200 EMA and do not enter on a random dip. Wait for the RSI to confirm the pullback is overdone. When RSI drops below 30 (oversold territory) and then crosses back above 30, it means the trend is up but the short-term momentum is temporarily exhausted and now turning back up. Enter a long trade.
Short Trade (price below 200 EMA): Wait for the price to rally up towards 200 EMA, wait for RSI to confirm by rising above 70 (overbought territory) and then crosses back below 70. The trend is down but a counter-trend rally is losing steam. Enter a short trade.
Stop Loss & Take Profit: Place the stop loss 1x ATR value below the recent swing low (for longs) or above the recent swing high (for shorts). A simple and effective approach for taking profit is using a 2:1 reward-to-risk ratio. If your stop loss is 30 pips wide, your target is 60 pips away. Alternatively, you can take partial profit when RSI hits the opposite extreme (70 for longs, 30 for shorts).
Example: EURUSD on the 4-Hourly Chart
Price is trading at 1.0850. The 200 EMA is at 1.0750. Price is above and take a long position. Price drops over a few candles down to 1.0780, getting closer to the 200 EMA. During this drop, the RSI falls to 28 (below 30). Wait and then the next candle closes and pushes the RSI to 32. You can enter a long trade at market open of the next candle. For the stop and target, the recent swing low was 1.0760. The ATR(14) >>14-period lookback is 0.0040 (40 pips). Your stop goes at 1.0760-0.0040 = 1.0720. Your target is set at a 2:1 ratio. Target will be entry + reward (2 * 40 pips = 80 pips).