What Are GDP, Inflation and Labour Market?
What Is GDP?
GDP (Gross Domestic Product) is the total value of all final goods and services produced within a country during a specific time period (a year or a quarter). This is used as a primary indicator of size, health, growth rate of an economy, rising living standards and overall wealth generation in a country.
GDP Growth
GDP growth is the percentage increase in GDP. It measures the expansion of an economy’s capacity to produce. Positive growth signalling expansion and negative growth indicates a recession (two straight quarters of negative GDP growth is often called as a technical recession). Nominal GDP measures production using current prices, while the real GDP adjusts for inflation to reflect volume changes.
Real GDP growth is the percentage increase in inflation-adjusted market value of all final goods and services within a country over a specific period (generally quarterly or annually). It measures increase in production volume only rather than just price changes. Higher figure means higher production, increased income, improved living standards and economic expansion. You cannot have the real income go up without productivity growth.
GDP Components
Using expenditure approach, GDP as a measure of a country’s economic activities is as follows:
GDP = C + I + G + (X – M)
C stands for private consumer spending on goods and services representing the largest component of GDP, and I for business investment or business spending on capital goods including construction, machinery, and changes in inventories. Expenditures by all levels of governments on goods and services are included in G, and (X – M) is for net exports, exports minus imports. A positive figure refers to a trade surplus, while a negative figure indicates a trade deficit.
What Is Inflation?
Inflation is the rate of increase in prices over a given time period. Both CPI (Consumer Price Index) and PCE index measure inflation. CPI is an index not one component. Core CPI excludes volatile food and energy prices and it gives a smoother trend rate of inflation.
CPI vs PCE index
Both CPI
(Consumer Price Index) and PCE index measures inflation but for the Federal
Reserve’s decision on interest rates, PCE (Personal Consumption Expenditure)
price index is what they are referring to as their inflation target of 2%.
Each
index quantifies changes in consumer prices by tracking changes in the prices
of a specific basket of goods and services each month. When the prices in that
overall basket rises, so does inflation rate.
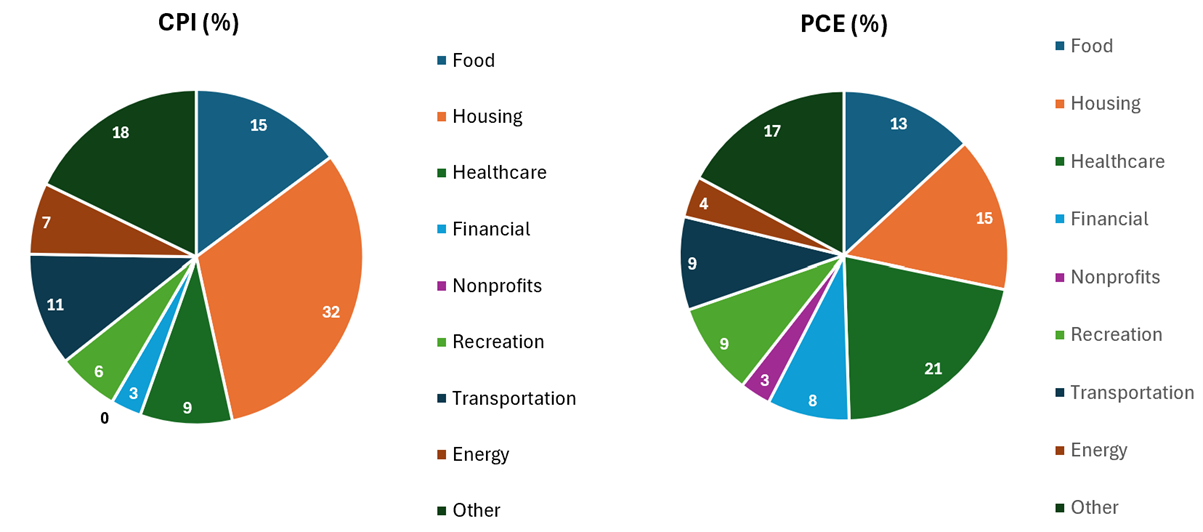
Difference in how components are weighted in the two indexes is one factor that is
responsible for the difference between CPI and PCE inflation. The most
pertinent example would be shelter prices and healthcare spending. CPI has
higher weight for housing (weighted approximately double in the CPI vs PCE)
while PCE data give heavier weightage to healthcare spending.
Another difference can be attributable to formula adjustments. While the PCE formula adjusts its weights monthly, CPI does so yearly. When there is change in the consumer behavior it will be reflected in PCE index first. In addition, PCE includes purchases made by urban and rural consumers but the CPI only tracks spending in the urban areas.
PCE accounts for expenditures made on consumers behalf as well. However, CPI includes only out-of-pocket direct spending made by the consumers. For example, health insurance expenses made by the employers and spending by nonprofit organizations on households’ behalf are included in PCE basket only. Therefore, PCE data is more comprehensive than CPI data.
Another difference is that the weight in the PCE is updated more frequently reflecting the impact of new technology and sudden change in consumer spending patterns more quickly. Also, the government can retroactively revise PCE data to include new data and measurement techniques, while CPI data is only revised to account for seasonal factors. Flexible substitution characteristic of the PCE formula is favored by many investors.
Compared to CPI, PCE price index will be a key reading for markets as this print is the Fed’s preferred inflation gauge and widely expected to be factored into long-term interest rate projections.
Demand-driven inflation vs Supply-driven inflation
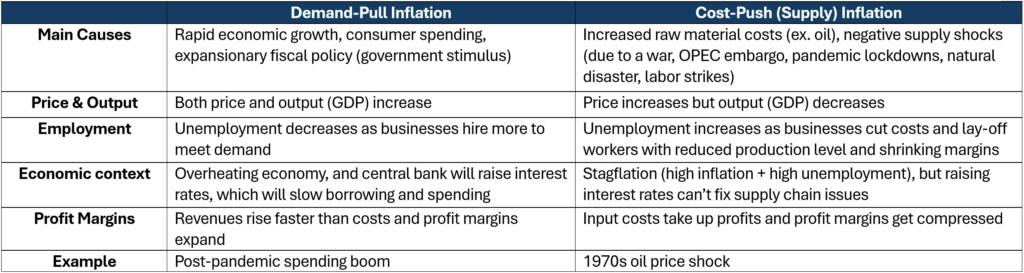
Demand-pull inflation is due to excessive demand (aggregate demand grows faster than aggregate supply) pulling prices up, while cost-push inflation occurs when production costs rise as a result of reduced supply. Demand-pull inflation increases output (higher real GDP) with economic growth and expansion. Cost-push inflation, on the other hand, causes economic contraction with reduced output (lower real GDP) often leading an economy to a stagflation. Both forms of inflation reduce the purchasing power of money but the impact of policy response is different. Governments address demand-pull inflation with tighter monetary or fiscal policy with reduced money supply, but cost-push inflation can get worsened by tightening monetary policy.
What is Stagflation?
Stagflation is an economic condition where the economic growth slows down with high unemployment but price keeps rising (high inflation) at the same time. 1970s oil crisis is an example of stagflation through supply shock. A spike in oil prices raised costs for businesses causing inflation, but at the same time it made it harder for them to hire and produce causing stagnation.
In stagflationary environment, prices for food, rent and gas will rise faster than wages of households. For example, if you get a 3% raise, 5% inflation will effectively mean you get a 2% pay cut. Cash in the bank account will lose purchasing power due to higher inflation and it will also hurt retirees on fixed income as well. Companies will have to pay more for raw materials and labour due to inflation but they cannot raise prices as the economy is in stagnation. Uncertainty about future demand will cause businesses to accumulate cash rather than to expand and hire more people. This is the reason why unemployment rate rises, while prices are shooting up. Central banks will have to raise rates to fight the inflation but higher rates will impact economic growth in a negative way potentially triggering deeper recession spiking unemployment rate further.
How the Inflation Data Affect Investment?
When the consumer price rises higher than the expected consensus, growth-sensitive stocks and bonds will come under pressure since higher inflation will reduce the present value of future earnings. Prices of energy and precious metals as real assets will go up. USD is also expected to rise with the expectation of tighter monetary policy (lifting rates above the neutral rates) due to higher inflation.
When the inflation data is below expectations, investors will consider the prospect of lower future rates (accommodative monetary policy), and hence USD is expected to go lower. This is supportive of bonds as lower inflation will help the value of future earnings.
How to Evaluate Labour Market Conditions?
There are a few key economic indicators used to evaluate the health of labor market.
Unemployment rate: It measures the percentage of the labour force (employed + unemployed) that is unemployed individuals actively seeking jobs, calculated as (Unemployed / Labour Force) * 100 . A lower rate signals healthy labour market with plentiful jobs.
Labor force participation rate: This refers to the percentage of total labor force (employed + unemployed) to working-age population. High figure indicates confidence in the job market.
Non-farm payrolls: This measures job creation, or the net number of jobs added or lost in the economy each month, excluding farm workers and a few other categories. It could measure economic momentum. Strong and consistent job growth signals a healthy and expanding economy, while weak or negative growth (job losses) can indicate a red flag for the economy and potentially a recession.
Job openings and labor turnover survey (JOLTS): Job openings measure the number of unfilled positions. A high number of openings means strong demand from employers for workers. Quite rate measures the number of people voluntarily leaving the jobs as a percentage of total employment. A high quits rates suggest a tight labor market where workers have confidence that they can find another, often a better job. In this market, workers have the power. Hire and lay-off rates show the churn in the market. Low lay-off shows stability in the labor market.
Average hourly earnings: It measures the change in wages for the workers on private non-farm payrolls. Rising wages signal a tight labour market. Economists will look at inflation-adjusted real wages. If nominal wages are rising by 2% but inflation is at 3%, workers’ purchasing power is actually falling.
With the robust economic growth, an improving labour market and wage growth can support consumer spending. Tighter labour environment will lead to higher wages, and higher wages will contribute to stronger demand and this will contribute to higher prices.
How the Job Market Data Affect Investment?
When the jobs data are positive (nonfarm payroll number is higher-than-expected, unemployment rate is falling and the participation rate and wages are increasing), growth assets such as equities and industrial metals price will go up. Energy will also benefit from it but it generally depends on the US dollar’s reaction. If US jobs data is good, USD will rally. Conversely, when there is a negative announcement relative to the expectations, this can be a sign of weakening economy requiring supportive policies. In this case, defensive assets such as bonds can rally and stocks will come under pressure.