What Is Yield Curve?
While the duration and convexity tell you how to quantify market rates’ impact on bond prices, the yield curve explains why the interest rates are changing in the first place.
A yield curve is a graphical line that plots the interest rates (yields) of bonds with the same credit quality but differing maturity date. The interest rate will be plotted on the Y-axis and time to maturity ranging from 1 month to 30 years will be on the X-Axis. The shape of the curve is a snapshot of what the market believes the future interest rate and economic conditions will be.
Yield
curve affects the profitability of banks as they borrow short-term and lend
long-term and the cost of borrowing for companies and home buyers. Front-end of
the curve is affected by policy rate (Federal funds rate in the US), while the
back-end of the yield curve is influenced by GDP growth and inflation
expectation. For example, when we derive 10-year yield, it will be combination
of forward growth rate, inflation expectation and term premium. 4.25% 10-year yield
will consist of 2% growth, 2% inflation expectation and 25bps worth of term
premium. Long-end of the curve generally reacts to the fiscal policy, supply of
government bonds (Treasuries for the US market), inflation uncertainty and
foreign demand rather than the central bank’s monetary policy.
What Are the Different Yield Curve Shapes?
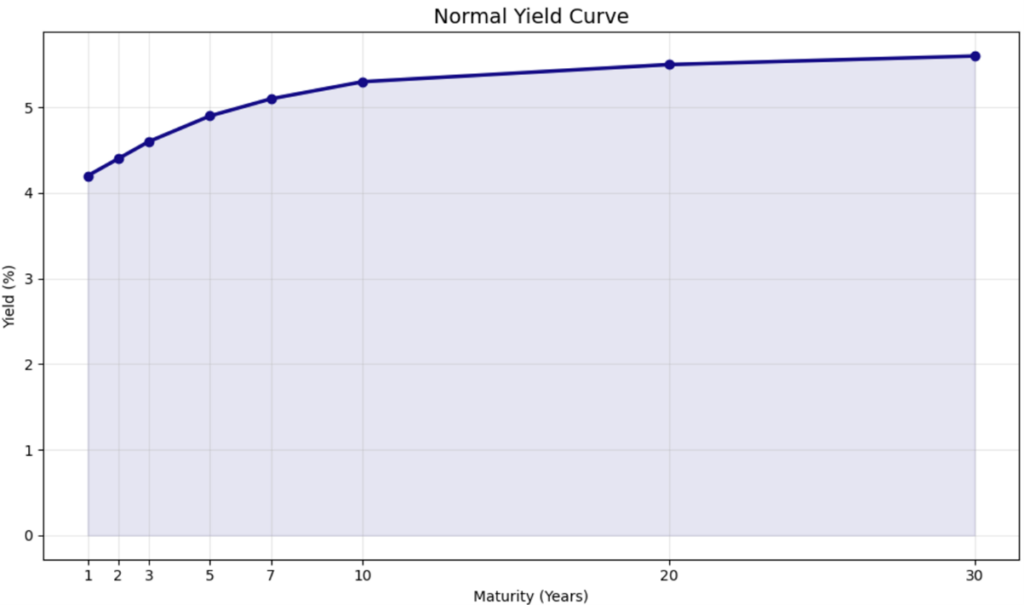
Normal (Upward Sloping): Normal yield curve shape is where the short-term rate is lower than the long-term rates and this upward-sloping yield curve indicates economic expansion. Investors demand a higher yield (higher term premium) for lending money long-term, as they take on more risk, especially inflation risk. Normal yield curve tell us that the market expects modest inflation and healthy economic growth.
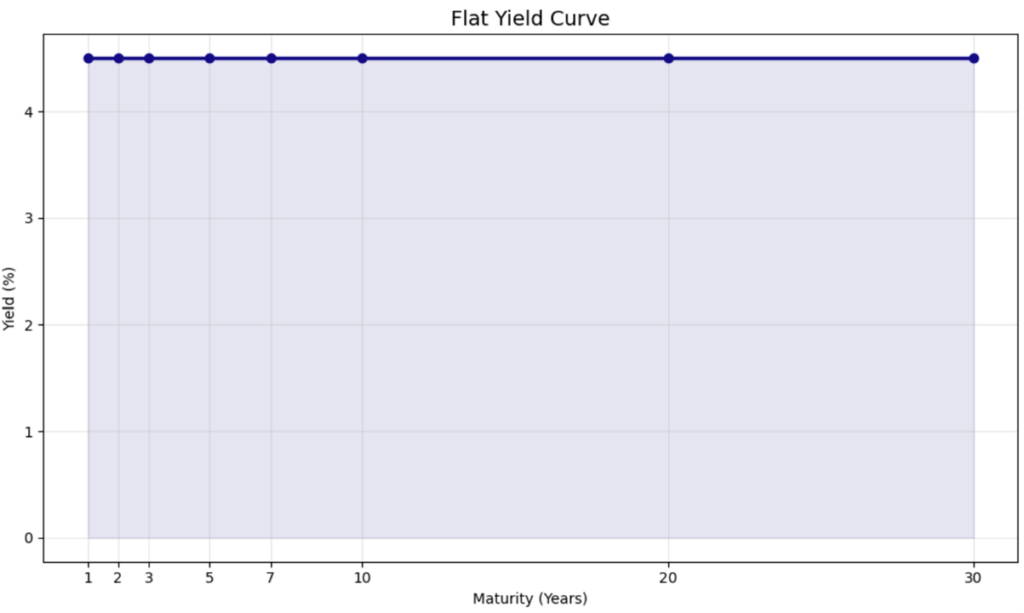
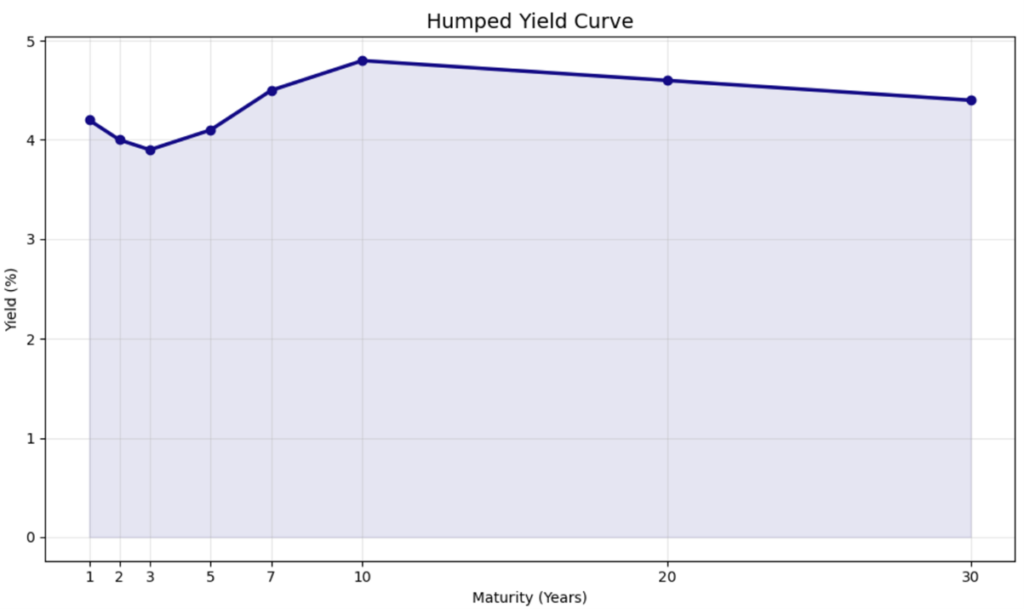
Flat or Humped: The yields are similar across all maturities for flat curve and it indicates economic transition often during monetary policy changes. Humped shape occurs when the medium-term yields are the highest and it is common during uncertain transition period. The economy may be slowing down from growth stage.
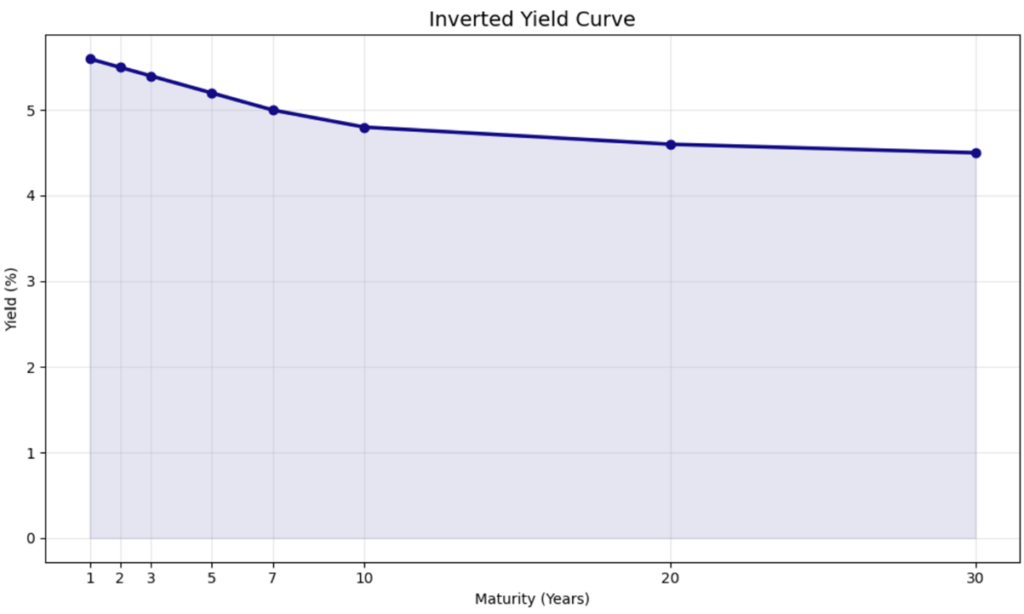
Inverted (Downward Sloping): This is when the short-term rates are higher than long-term rates and it often predicts a recession in an economy. Investors expect that future rates will fall. Investors are rushing to buy long-term bonds, driving long-term yields down as they are fearful of a recession. Investors are willing to accept a lower return to lock-in money safely long-term. Central banks often raise short-term interest rates to fight inflation. An inverted yield curve has been a reliable predictor of major recessions in the past. It suggests that the market believes the economy will weaken severely in the future.
What Does the Shape-Shifting of Yield Curve Tells Us?
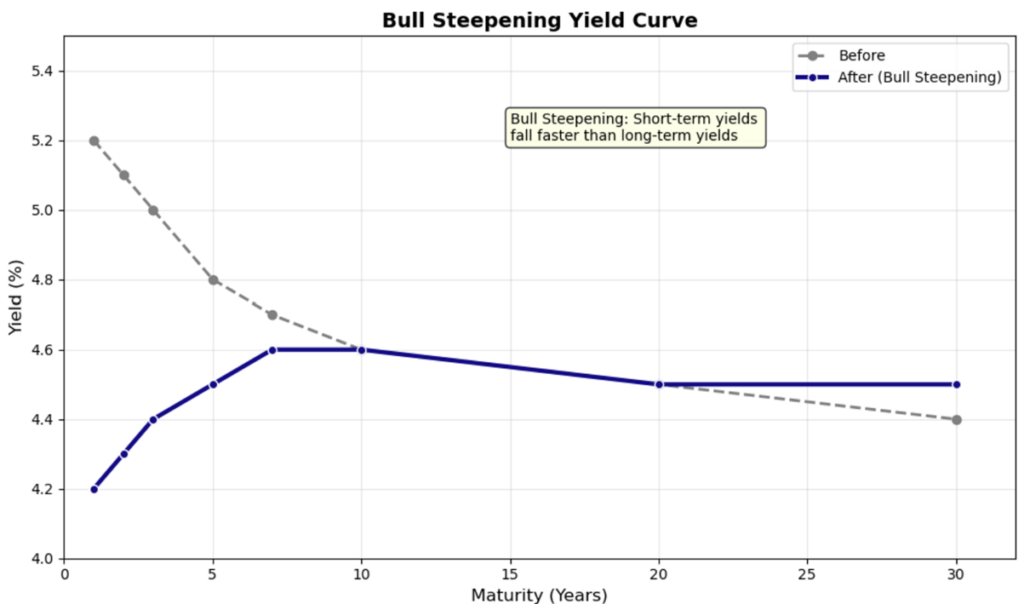
Bull steepening = lower front-end yields, steeper yield curves
Bull steepening happens when the short-term rates fall faster than long-term rates, widening the spread between them. It creates a steeper yield curve and usually signals market expectation of Federal Reserve’s rate cuts generally in response to a slowing economy, which is bullish for short-term bonds. Bull steepener is often constructive for equities as the lower rates can support economic activities. However, it can appear concurrent with the macroeconomic stress.
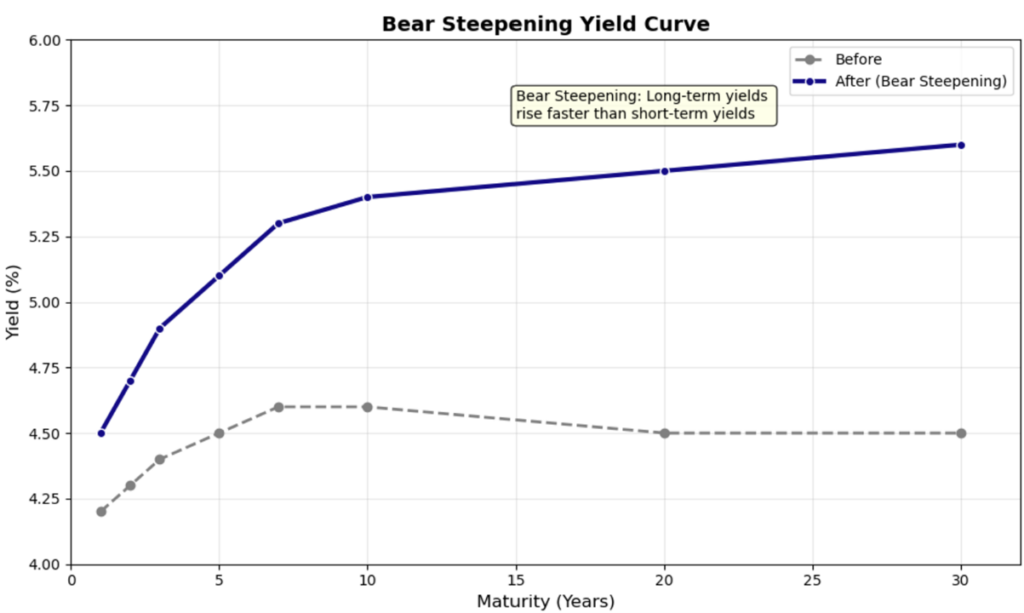
Bear steepening (Bear Twist) = higher long-end yields, steeper curves
Bear steepening occurs when the long-term bond yields rise faster than the short-term yields increasing the gap between the two. Long-end rises faster than the short-end which stays anchored or rises slower. It can imply inflation fears, higher economic growth expectations, or rising sovereign debt issuance which will affect investors to sell long-term bonds while short-term rates remain relatively stable.
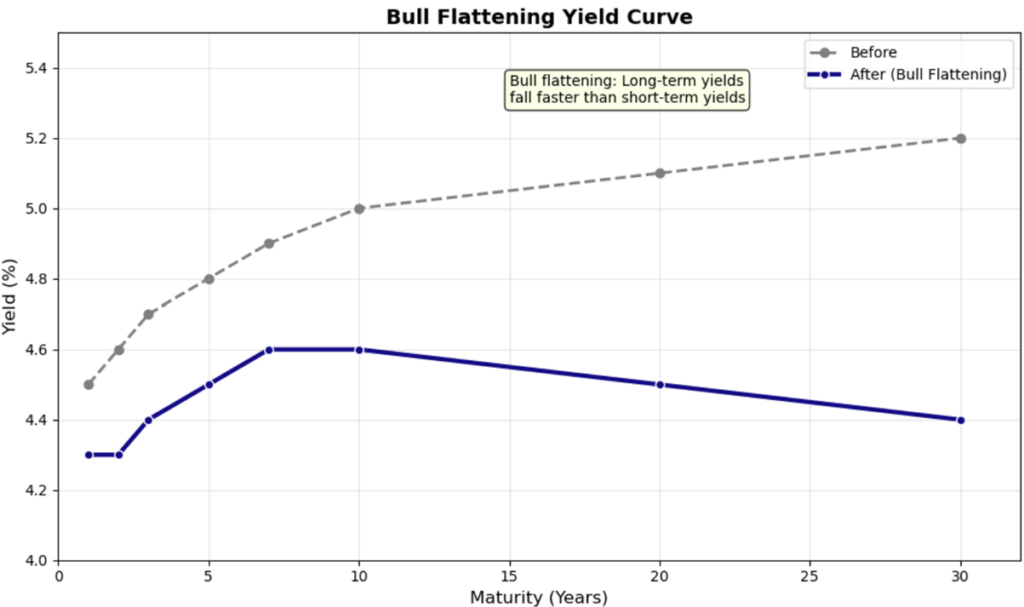
Bull Flattening = lower long-end yields, flatter curves
Bull flattening occurs when long-term rates fall faster than short-term rates often signalling market expectation of slower economic growth. This is driven by “flight to safety” demand for longer-dated bonds during a cooling economic and investors anticipate a dovish central bank with a potential for a rate cut.
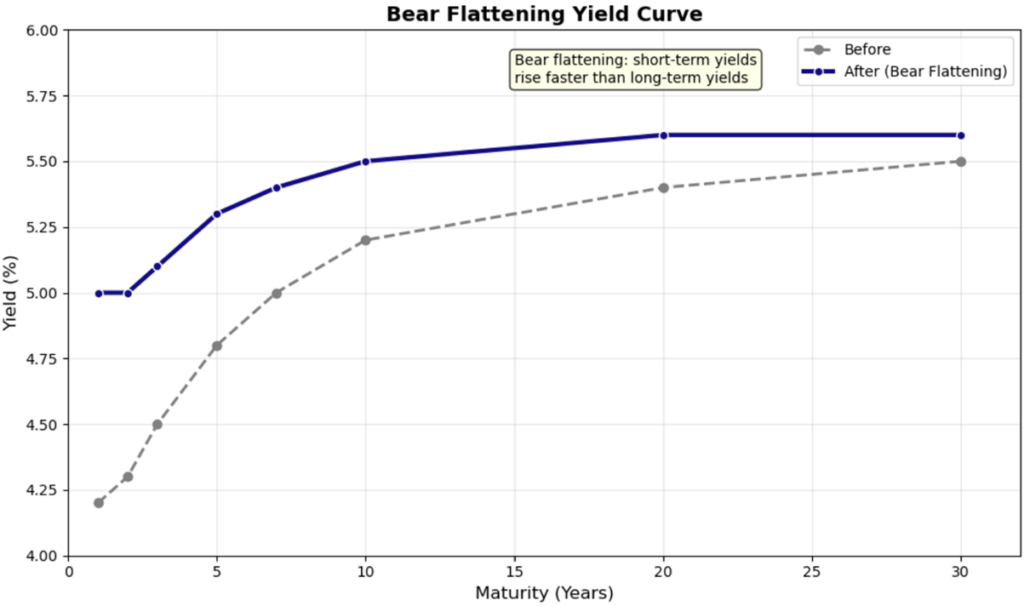
Bear Flattening = higher front-end yields, flatter yield curves
Bear flattening occurs when short-term rates rise faster than long-term rates, which signals monetary tightening. This happens when the central bank raises rates to fight inflation or to slow down an overheating economy.